How to Determine Crystallite Size, FWHM, and Crystal Structure from XRD Data
X-ray Diffraction (XRD) is a powerful analytical technique used to determine the crystallographic structure, chemical composition, and physical properties of materials. One of its most important applications is the characterization of crystallite size, Full Width at Half Maximum (FWHM), and crystal structure of powders and thin films.
Let’s dive into the key concepts, how they are extracted from XRD data, and what they tell us about the material.
What is XRD?
XRD works by directing X-rays at a crystalline material and measuring the intensity of the diffracted rays as a function of the diffraction angle (2θ). The positions and intensities of the diffraction peaks in the XRD pattern provide information about the atomic arrangement and microstructure of the material.
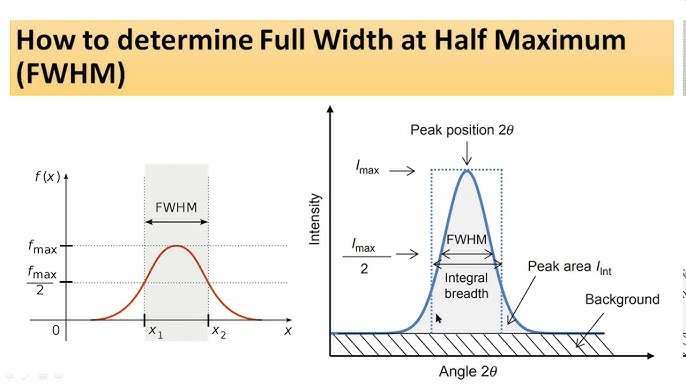
Understanding FWHM (Full Width at Half Maximum)
FWHM is a measure of the broadening of an XRD peak and is defined as the width of the peak at half its maximum intensity.
Why is FWHM important?
- Narrow peaks → large, well-ordered crystallites
- Broad peaks → small crystallites and/or lattice strain
How to Measure FWHM:
- Identify the peak of interest in the XRD pattern.
- Note the maximum intensity (Iₘₐₓ).
- Find the intensity at half the maximum (Iₘₐₓ/2).
- Determine the width of the peak at this intensity level.
- The FWHM is usually given in degrees (2θ), but it needs to be converted into radians for further calculations.
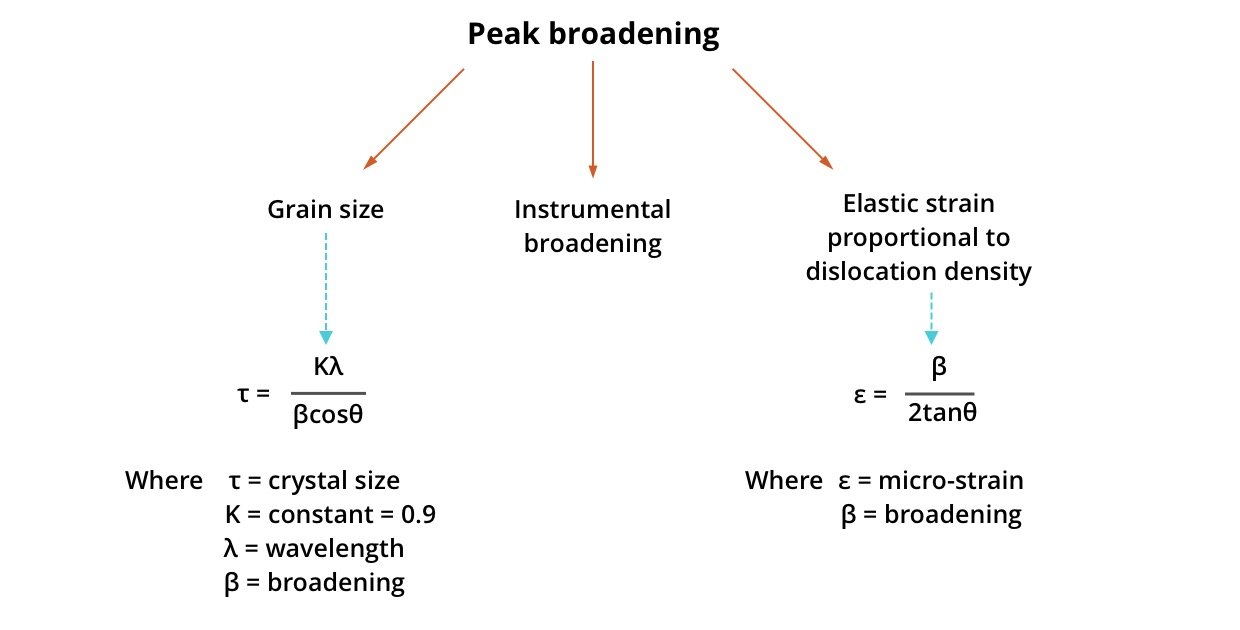
Crystallite Size from XRD: The Scherrer Equation
One of the most common ways to estimate the crystallite size is by using the Debye-Scherrer Equation:
D = Kλ / βcosθ
Where:
- D = crystallite size (in nanometers)
- K = shape factor (typically ~0.9)
- λ = X-ray wavelength (e.g., 1.5406 Å for Cu Kα radiation)
- β = FWHM of the peak in radians
- θ = Bragg angle (in degrees)
Key Notes:
- Only applies when broadening is due to crystallite size, not strain or instrumentation.
- Best applied to highest intensity peak, but multiple peaks can be analysed for accuracy.
Example:
If a peak at 2θ = 30° has a FWHM (β) of 0.2°:
- Convert β to radians: βrad = 0.2 × (π / 180) ≈ 0.00349
- θ=15∘ so cosθ = cos (15∘) ≈ 0.9659
- Using Cu Kα, λ = 1.5406 Å
D = (0.9×1.5406) / (0.00349×0.9659) ≈ 407.6 A˚≈ 40.76 nm
Determining Crystal Structure from XRD Patterns
The positions and intensities of the peaks reveal the crystal structure. Here’s how:
1. Peak Position (2θ) → Interplanar Spacing (d-spacing)
Use Bragg’s Law:
nλ = 2dsinθ
To find d-spacing for each peak. The d-values are then compared with reference databases (e.g., ICDD or JCPDS) to identify the phase.
2. Peak Indexing
Each diffraction peak corresponds to a set of crystal planes (hkl). Using the known crystal systems (cubic, tetragonal, hexagonal, etc.), you can assign Miller indices (hkl) to each peak. For example:
- Cubic systems follow:
1/d2 = (h² + k² + l²) / a2
Plotting sin2θ vs. integer values of (h² + k² + l²) can help identify the lattice parameter a.
3. Phase Identification
Once you have d-spacing and peak intensities, compare with standard reference cards using:
- Powder Diffraction File (PDF) databases
- Software like X’Pert HighScore, Match!, Jade, etc.
Additional Considerations
Instrumental Broadening
Peak broadening can be due to the instrument, not just the sample. To correct:
βsample = Sqrt (β2measured − β2instrument)
You must first measure a standard sample with large, well-defined crystals to get βinstrument.
Micro strain and Dislocations
Another source of peak broadening is micro strain in the crystal lattice. Advanced methods like Williamson-Hall Plot can separate size and strain effects.
βcosθ = Kλ / D + 4ϵsinθ
Where ϵ is the strain.
Summary: Step-by-Step
Step | What You Do | What You Get |
1 | Run XRD scan | Get intensity vs. 2θ pattern |
2 | Measure peak FWHM | Use for size and strain |
3 | Use Bragg’s Law | Calculate d-spacing |
4 | Apply Scherrer equation | Estimate crystallite size |
5 | Index peaks | Identify Miller indices (hkl) |
6 | Match with reference database | Determine phase and structure |
Conclusion
XRD is an essential tool in materials science, offering insights into the size, structure, and quality of crystalline materials. With careful analysis—accounting for factors like instrumental broadening and strain—you can extract meaningful and accurate data from your XRD patterns.
Whether you’re analysing a new nanomaterial or validating a synthesis process, XRD gives you the crystal-clear picture you need.